
The backend might be invisible, but it has a huge impact on your experience.
At first, having all your data in a single table feels convenient. Everything’s in one place – no need to cross-reference or stitch things together. But as your business grows and your data balloons into tens or hundreds of thousands of rows, that flat setup starts to choke. Your dashboard loads slower, calculations lag, and even simple filters take forever to apply. The good news? There’s a smarter way to structure your data.

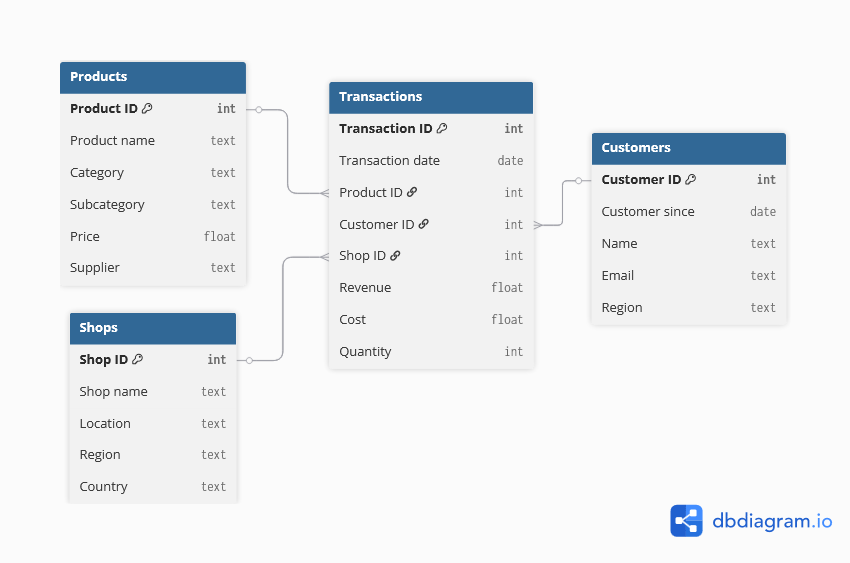
Yes, we know – database structures don’t exactly scream excitement. But stay with us, because this one concept can seriously speed up your dashboards. A relational database is just a smart way of organizing your data into multiple interconnected tables, each with a clear role. Think of it like this:
You’ll often see this setup drawn as a star because everything radiates from the fact table. And once you use it, you’ll never want to go back to messy all-in-one spreadsheets.

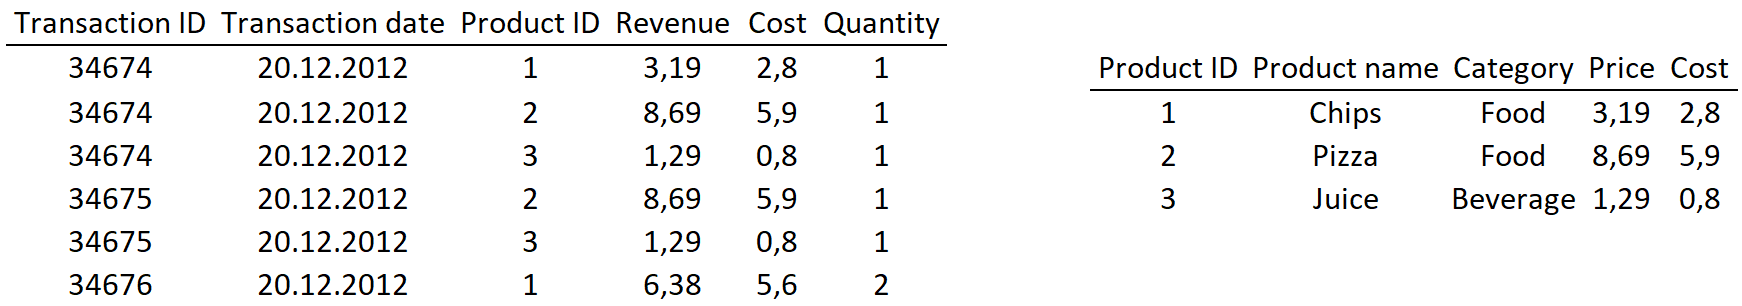
Take a look at the two table views below. Which one’s easier to read and which one has less repeating values? The view with one table or with two?
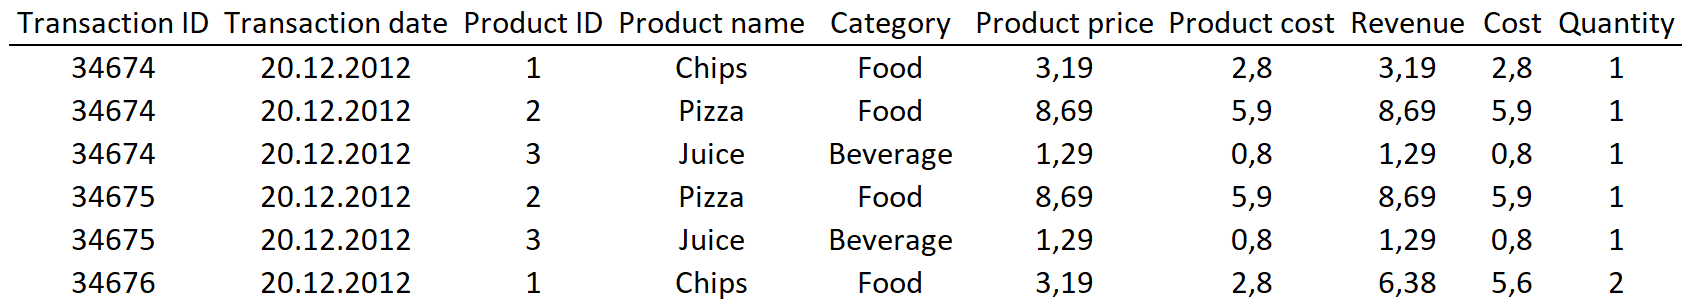
If you don’t organize your data into appropriate tables and rely on just one, you’ll end up with a table that’s both long and wide, and that’s rarely a good thing. Long, wide tables? Not a great combo.
With small datasets, you might not notice the problem. But once you’re dealing with hundreds of thousands of rows, those repeated values start slowing everything down. Calculations take longer, load times creep up, and spotting errors gets harder.
A relational structure solves this. It avoids unnecessary repetition, keeps your storage lean, and makes your tables easier to read and work with. Fact tables handle the dynamic, fast-changing part of your data: the actual transactions or events. Dimension tables store the slower-changing context. That way, each table does what it's best at. Less duplication, faster calculations, cleaner logic. Better structure = faster insights.

Relational databases aren’t an advanced concept, but they’re essential for performance behind the scenes. Some BI developers rely on a flat table structure. It’s easier to set up, but the tradeoff is performance. Dashboards built this way slow down as your data grows.
Our dashboards use a relational structure instead, which keeps them fast even with large datasets. Yes, this setup takes a bit longer to load the data, but that’s by design. Our ETL process (Extract, Transform, Load) takes your spreadsheet – no matter how it’s structured – transforms it into a clean, efficient model, and loads it outside office hours.
We’ve optimized for responsiveness during use, not for shaving seconds off an overnight load. The backend might be invisible, but it shapes your whole experience. There’s more to our dashboards than meets the eye.

Understand your costs.
Focus your resources.
Pricing tier 1: Clarity

Track your goals and KPIs
with a high-level overview.
Pricing tier 2: Focus

Know what sells.
Optimize what doesn't.
Pricing tier 2: Focus